Calling R enthusiasts! Looking to advance your data analysis skills? The Student and Recent Graduate Committee (SARGC) invites you to join our 2025 Skills Workshop on immersive data analysis.
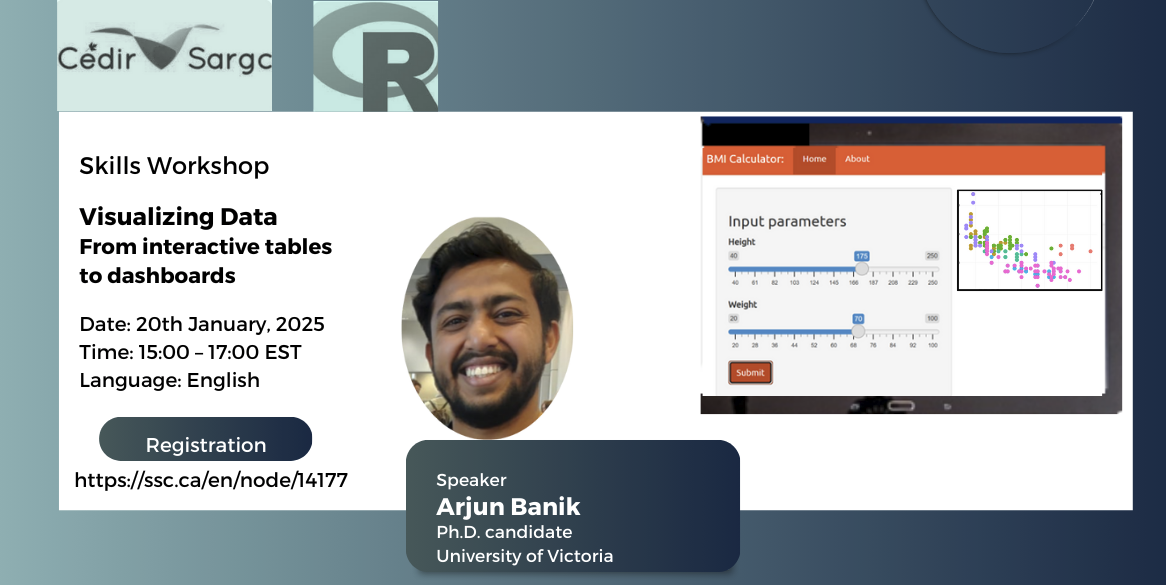
Visualizing Data: From Tables to Interactive Dashboards
January 20th, 2025
15:00-17:00 EST
Presenter: Mr. Arjun Banik
What you’ll get:
1. Create a data visualization.
2. Create your own interactive dashboard!
What you’ll need:
1. Basic familiarity with R and RStudio.
2. Installations: Zoom, R, RStudio.
3. Packages installed: ggplot2, plotly, shiny, dplyr, viridis
About the speaker:
Arjun Banik is a Ph.D. candidate in Statistics at the University of Victoria. He will be teaching the course, “Data Management and Presentation”, during the Winter 2025 term.
Looking forward to seeing you at the event!